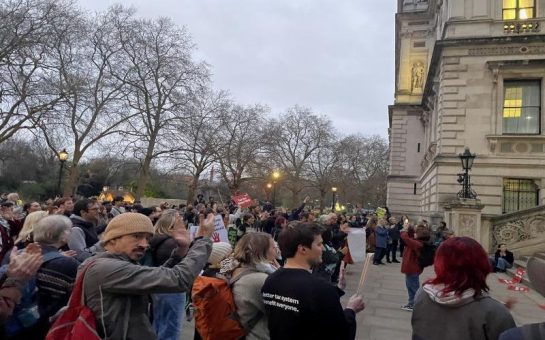
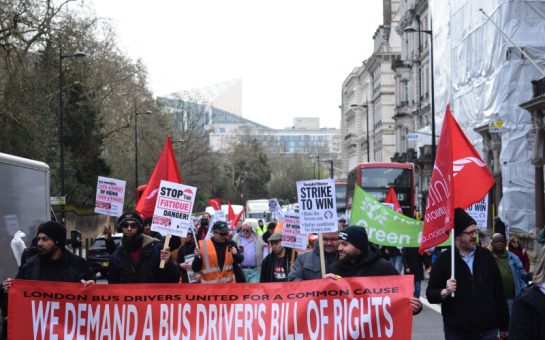
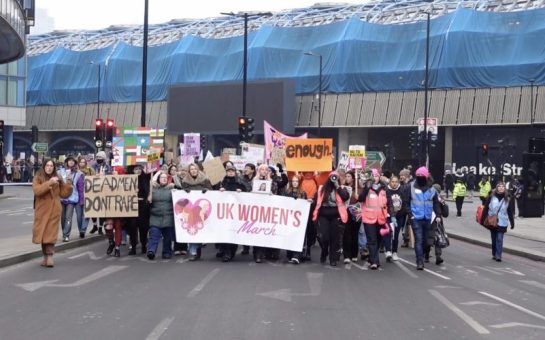
The Teachers’ Union joined the Trade Union Congress protest march to Parliament on June 18 in support for better pay and conditions during the cost-of-living crisis.
The Teachers’ Union NASUWT carried out a survey about the problems in the industry, which was completed by over 10,000 teachers.
It showed that 98% of member teachers disagree with the government pay freeze for all qualified teachers in 2021/22.
NASUWT president Michelle Codrington-Rogers said: “It is absolutely shameful of this government.
“Teaching used to be seen as a profession that people wanted to go into.
“Now we’ve got members who are using pay day loans, going to food banks, and often feeding the children in front of them from their own lunch boxes.
“That is an absolute disgrace.”

The NASUWT Submission to the Schoolteachers’ Review Body 4 March 2022 paper shows a massive shortfall between inflation increases and their wages.
By September 2021 teachers had already suffered a 17% cut to their real wages since 2010 because of inflation.
The graph below shows inflation through Retail Price Index (RPI) and Commercial Price Index (CPI) compared to teachers’ pay.
The price indexes track inflation through monitoring changes in price for certain goods and services in the economy.
The green line is a teacher’s best-case scenario in the maximum main pay range, and the purple line shows where no cost-of-living award has been given since 2014, their worst-case scenario.
It shows a massive shortfall that has been growing since 2010.
RPI is particularly high, which NASUWT say is the index that is more accurate when measuring the effect of inflation on teacher’s cost of living.
This is because two thirds of employers use it when calculating wage awards as its price range covers impact the workforce more directly than CPI.
For new teachers where student loans are a significant expenditure RPI is also more accurate when looking at inflations effects.
The union has calculated the cumulative payment shortfall due to inflation that teachers have suffered since 2010 in each of their pay ranges after salary freezes and lower than RPI salary increases
Some teachers have lost out on just under £178,000 in this time.
This bar chart shows this data, with each colour representing a different payment range which teacher pay is divided by from Main, Upper to Leadership and their subsections.
The Office of National Statistics shows that RPI is now at 11.8%, the highest it’s been in over 40 years, and CPI is at 7.9%, the highest it’s been in over 30 years.
NASUWT general secretary Patrick Roach said: “We’ve got inflation running at 11%, we’ve got teacher’s pay which has been cut by 20%.
“Teachers can’t make ends meet, children are suffering, teachers are saying enough is enough.
“Things have got to change.”
This graph shows the rate of inflation in RPI and CPI against the rate of increase of teacher’s wages in the best and worst-case scenarios and illustrates the gap growing between them.
It is particularly evident in the last year where the inflation indexes are almost going in an opposite direction to teacher wages.
Roach went on to explain the end game for the union’s campaign: “We would restore the morale of teachers if pay was keeping pace with the rising costs out there.
“Children need teachers, their futures are not going to be there unless they’ve got qualified and committed and highly motivated teachers in their classrooms.
“At the moment the government is doing everything to stop graduates from entering the profession, and when graduates do come into the profession they’re leaving.
“Within five years 40% of new teachers are leaving the profession because of low pay.”
At the protest, the Teacher’s Union were one of the most loud and lively, complete with their own marching brass band and hundreds of blue flags with their logo on them.
