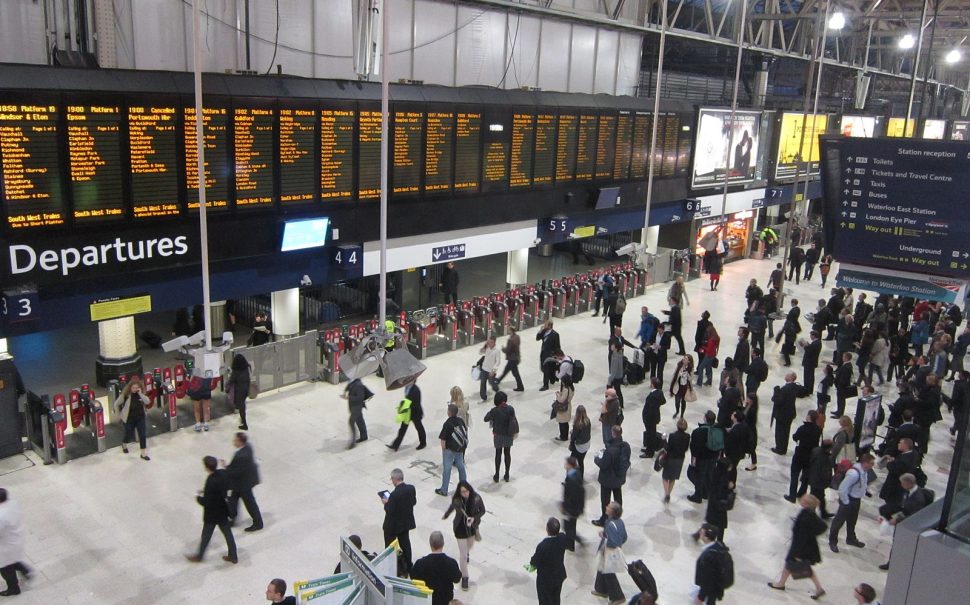
Londoners’ commutes have been altered by and since the pandemic, as a combination of increasing travel costs and the growing trend of hybrid work has shaped how people travel in London.
Even three years after lockdowns ended, travel habits, costs, and patterns across the city are far from their pre-pandemic numbers.
Daily trips have not returned to pre-pandemic levels, recent data from Transport for London (TfL) shows.
Before the pandemic, Londoners made 27.4 million daily trips, which dropped to 20.5 million in 2020 during the peak of lockdown.
By 2022, daily trips recovered to 24.7 million, but the 2023 figures remained 10% lower than in 2019.
Julie Meadows, a business consultant based in Wimbledon, mentioned hybrid working has been the biggest change.
She said: “I used to commute into central London five days a week. Now, it’s just twice a week. The flexibility has been great, but I’m definitely spending more on travel when I do go in.”
The cost of travel in London has significantly increased with demand from commuters decreasing due to hybrid working meaning a lot more employees do not commute five days a week.
This has left public transport in London slow to recover, affecting bus and underground routes.
In October 2023 demand for the London Underground and buses was at 84% of pre-pandemic levels, while road traffic volumes reached 92% of pre-pandemic levels.
This shift is largely due to hybrid work, as 42% of Londoners in 2021 worked from home at least some of the time, compared to just 5% in 2011.
Hybrid work has caused fewer people to commute daily, weekday public transport demand remains lower, although weekend travel for leisure activities has rebounded.
Transport for London has seen significant changes in commuting patterns post-pandemic.
A TfL spokesperson noted: “The greater facility for hybrid working among a proportion of the workforce is key among these changes, particularly affecting commuter and business travel demand on public transport.”
Despite the introduction of a £24 million scheme by Mayor Sadiq Khan to reduce fares on Fridays, TfL reported it had “no noticeable difference” in passenger numbers.
Commuting costs have increased since the pandemic affecting Londoners across all income levels.
The cost of a monthly Travelcard (Zones 1–6) increased from £270 in 2019 to £284 in 2023, a 5.2% rise including a increase in single fare zone 1 tube journeys, petrol prices, London parking fees and Bus fare.
For those who drive, the Ultra Low Emission Zone (ULEZ) expansion to cover all London boroughs in 2023 added an extra financial burden, with non-compliant vehicles facing a £12.50 daily charge.
Daily public transport trips fell from 35% in 2019 to 31% in 2022, as more people turned to walking and cycling.
Walking now accounts for 27% of trips, up from 25% in 2019, while cycling rose from 3.6% to 4.5%.
Car use makes up 35% of daily trips in 2023, compared to 36% in 2019. The flexibility of hybrid work has made private car use more appealing, though it raises concerns about congestion and air quality.
With more people working remotely, the average commuting time for Londoners dropped.
In 2023, the average commute time was 38 minutes, while before the pandemic it was 44 minutes.
Peak commuting hours have decreased and weekday demand for public transport remains lower than before, though leisure-related trips have surged on weekends.
TfL data shows that shopping, dining, and social outings have become more frequent travel reasons during weekdays.
Hybrid working appears to be a permanent shift changing weekday travel demand which is causing financial challenges for TfL as fare income has dropped significantly.
Meanwhile, the cost-of-living crisis is pushing more Londoners to explore cheaper travel options like cycling and walking.
For Londoners, the post-pandemic commute is evolving rapidly and flexibility and affordability will continue to drive decisions about how they travel.
Data and statistics are found from the Office of National Statistics (ONS) and from the Transport for London (TfL).
Featured image free to use via Wikimedia Commons under CC 1.0 licence


